DuckDB Vector Tiles Demo
DuckDB can now serve Vector Tiles directly from your datalake
A pleasant alternative to PostGIS
What is a Vector Tile
Vector Tiles are clipped tiles, or grid squares, composed of layers of vector features. They are served in a similar way to raster tiles. A client application requests tiles based on a zoom level and extent, and the server responds with binary data representing the vector tiles containing the layers to be visualised on that map. Rendering is done in the client.1
DuckDB Spatial added support for Vector Tiles with release 1.42.
What is DuckDB
DuckDB is a high-performance analytical database system. It is designed to be fast, reliable, portable, and easy to use. DuckDB provides a rich SQL dialect with support far beyond basic SQL. DuckDB supports arbitrary and nested correlated subqueries, window functions, collations, complex types (arrays, structs, maps), and several extensions designed to make SQL easier to use.
DuckDB is available as a standalone CLI application and has clients for Python, R, Java, Wasm, etc., with deep integrations with packages such as pandas and dplyr.3
Why do I tell you this
Vector Tiles make it easy to serve spatial data. DuckDB makes it easy to analyse spatial and non-spatial data. Traditionally, spatial data is stored in a database like PostgreSQL with the PostGIS extension to enable spatial functions. Serving is done through a dedicated GIS server like Geoserver. However, more and more organisations are moving to a data lake architecture, where data is not neccesarily stored in a database, but as files on shared storage. This is breaking down organisational siloes, and allows greater integration of data. Hadoop and Spark – or their cloud native siblings like Databricks, Snowflake and BigQuery – are used for analytical processing and sharing of data. However, for many organisations this is simply overkill4.
DuckDB has created the technology to interact with many data sources in a unified way. From all the options out there, the spatial support is one of the best, in my experience. As a Data Engineer with a GIS background, this gives us some exciting integration possiblities.
Demo time
Recently, Max Gabrielsson worked on the latest release of DuckDB Spatial. He included a small demo of how to use the functionality.
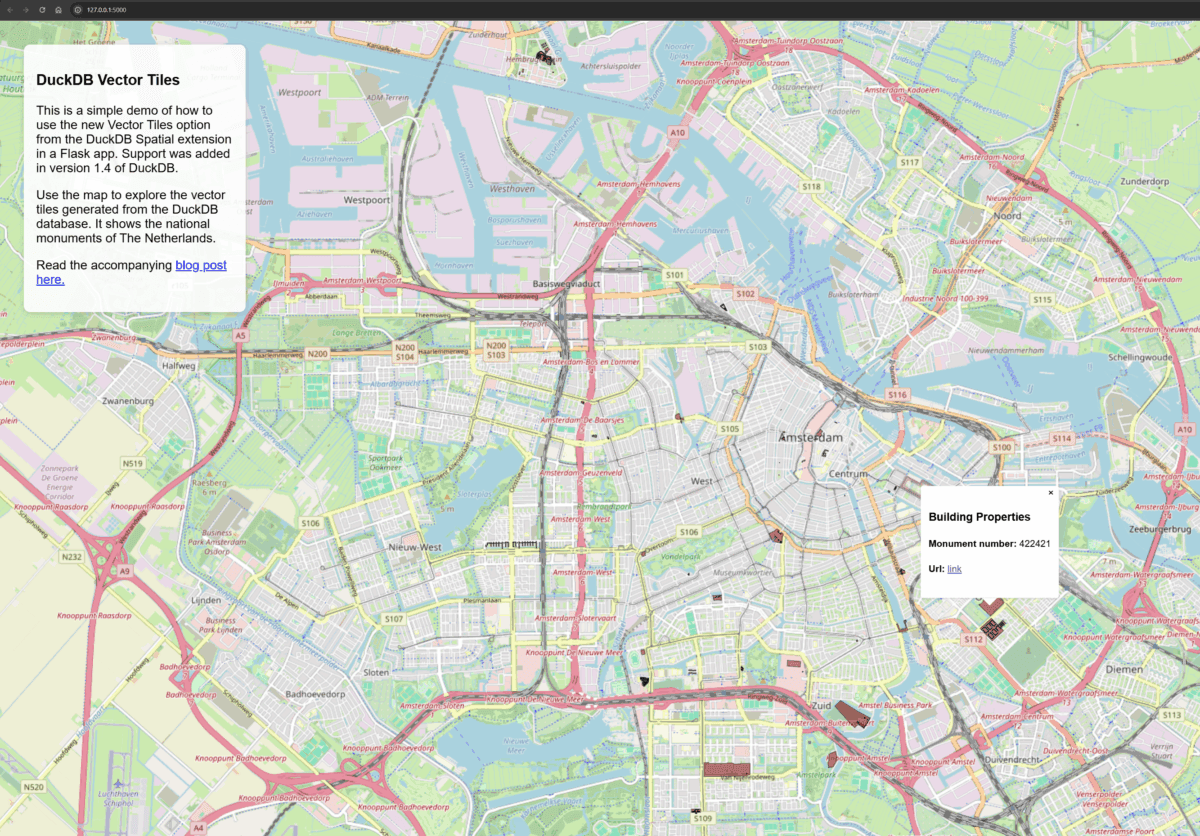
In order to get other people up and running, I created a full demo based on Max’s work, that loads some spatial data into DuckDB and renders it as Vector Tiles in a map as part of a Flask app.
The interesting part for me was that I never made a Flask app before. That turned out a bit challenging to get the conecpts, but can be very useful for quick prototyping.
I added a whole bunch of comments to walk you throught the process, and will describe it here from a high level perspective. If you just want code, just clone the repo.
Loading data into DuckDB
DuckDB can load a plethora of data with all sorts of connectors. Check their documentation for all options. The spatial extention, adds a couple of extra options. Adding spatial data to your DuckDB database can be as easy as:
CREATE TABLE IF NOT EXISTS monuments AS SELECT * FROM st_read('{data}');<br>Data can be a variable that points to a local file, but it can also take a URL for example.
The whole process of creating a local database, installing the spatial extension and loading data is handled by the init_database function. This is imported as a module, to make Flask wait for it to load, before launching the app.
Flask app
The Flask app itself is a very basic app in __init__.py. Most of it lives in the INDEX_HTML variable, which stores CSS, HTML and Javascript that is served by Flask and rendered in the browser. It is served on the root of the server. The real magic happens in the get_tile function. This function is serving the data from DuckDB and is sending it to the client for rendering. The function selects the geometry, and some additional properties for displaying, based on the overlapping OSM tiles. This way, only the data for the monuments is loaded if they are within the current map view. By leveraring the spatial ST_Intersects function in combination with the ST_AsMVT function, only those monuments are retrieved from DuckDB that would be visible, allowing for greater performance.
Running
To run the app, simply clone the repo and run the __init__.py in your favorite code editor. This will create a local DuckDB database, loads the GeoJSON data into that and launches the Flask app. Then visit http://localhost:5000 and start exploring.